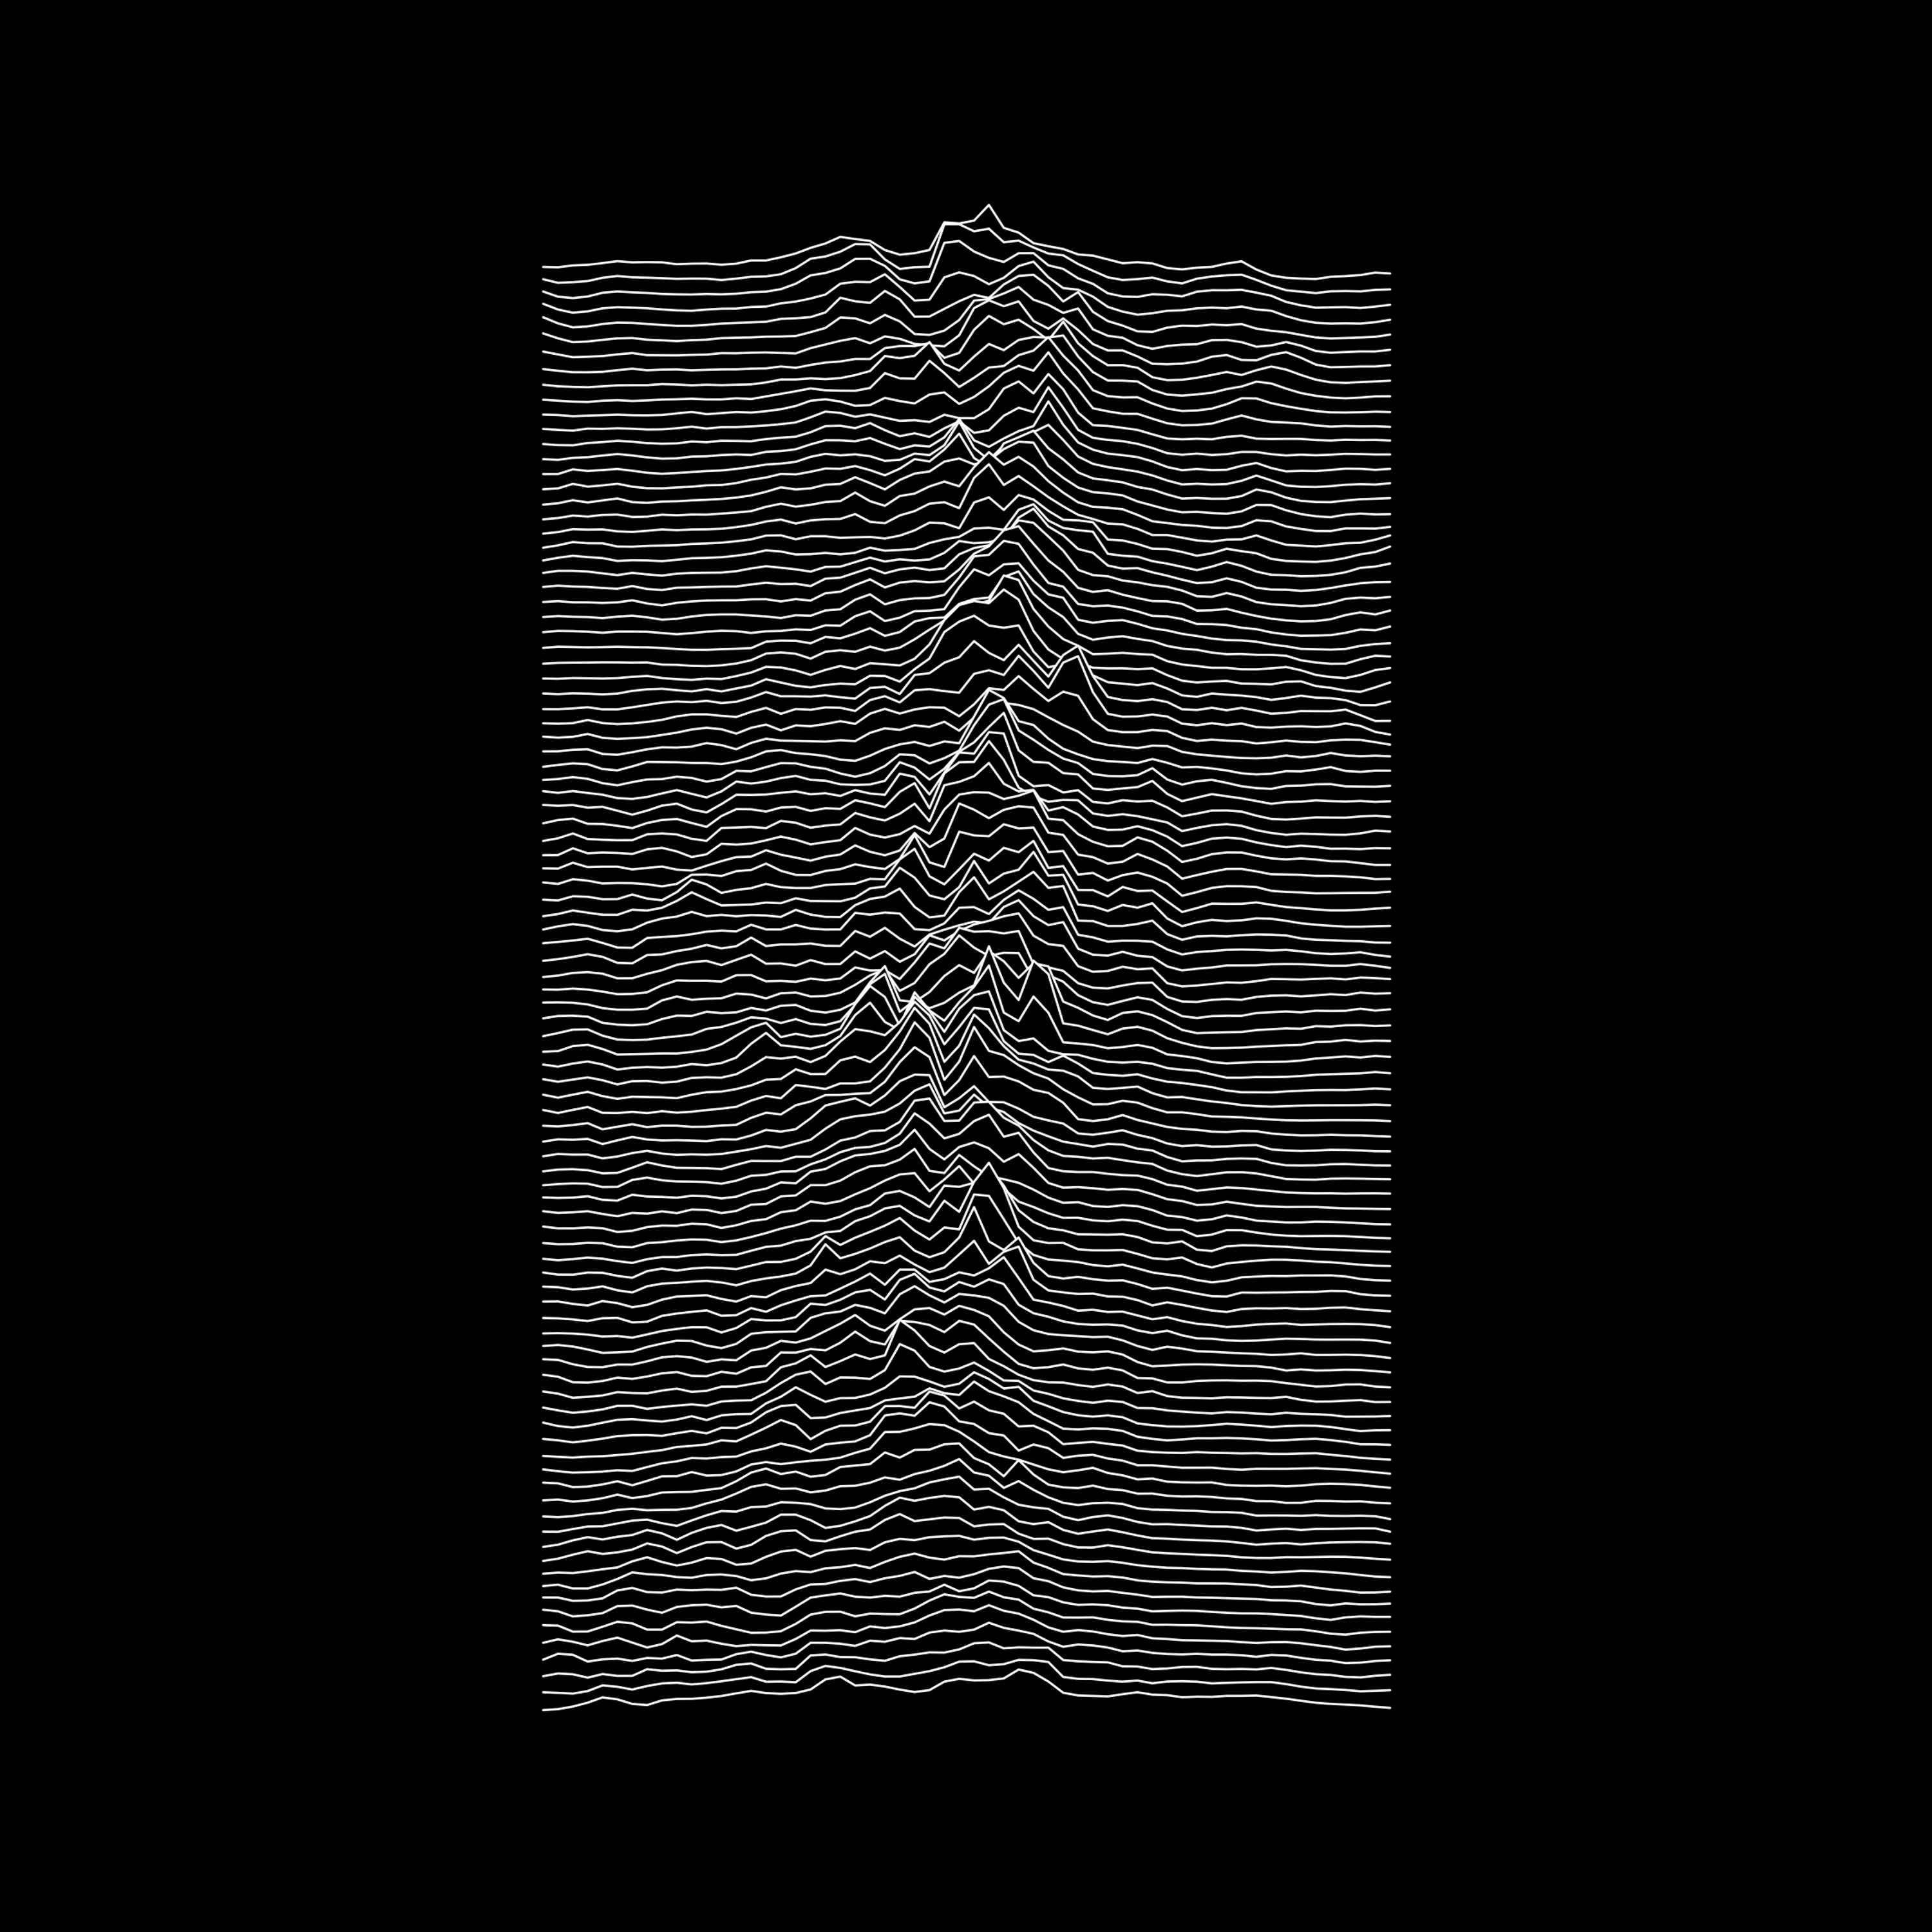
A fairly simple ‘map’ showing the elevation of a section of the Ural Mountains, produced in R with the ggridges package.
This kind of plot is often called a ‘joy plot’ after the album cover of Joy Division’s Unknown Pleasures, which my map wholeheartedly rips off.
The R code to produce the map is available here.
The elevation data comes from AWS Terrain Tiles and is accessed via elevatr::get_elev_raster().