A map of Wollaton Park in Nottingham – right click → Open Image in New Tab to have a look at all the details.
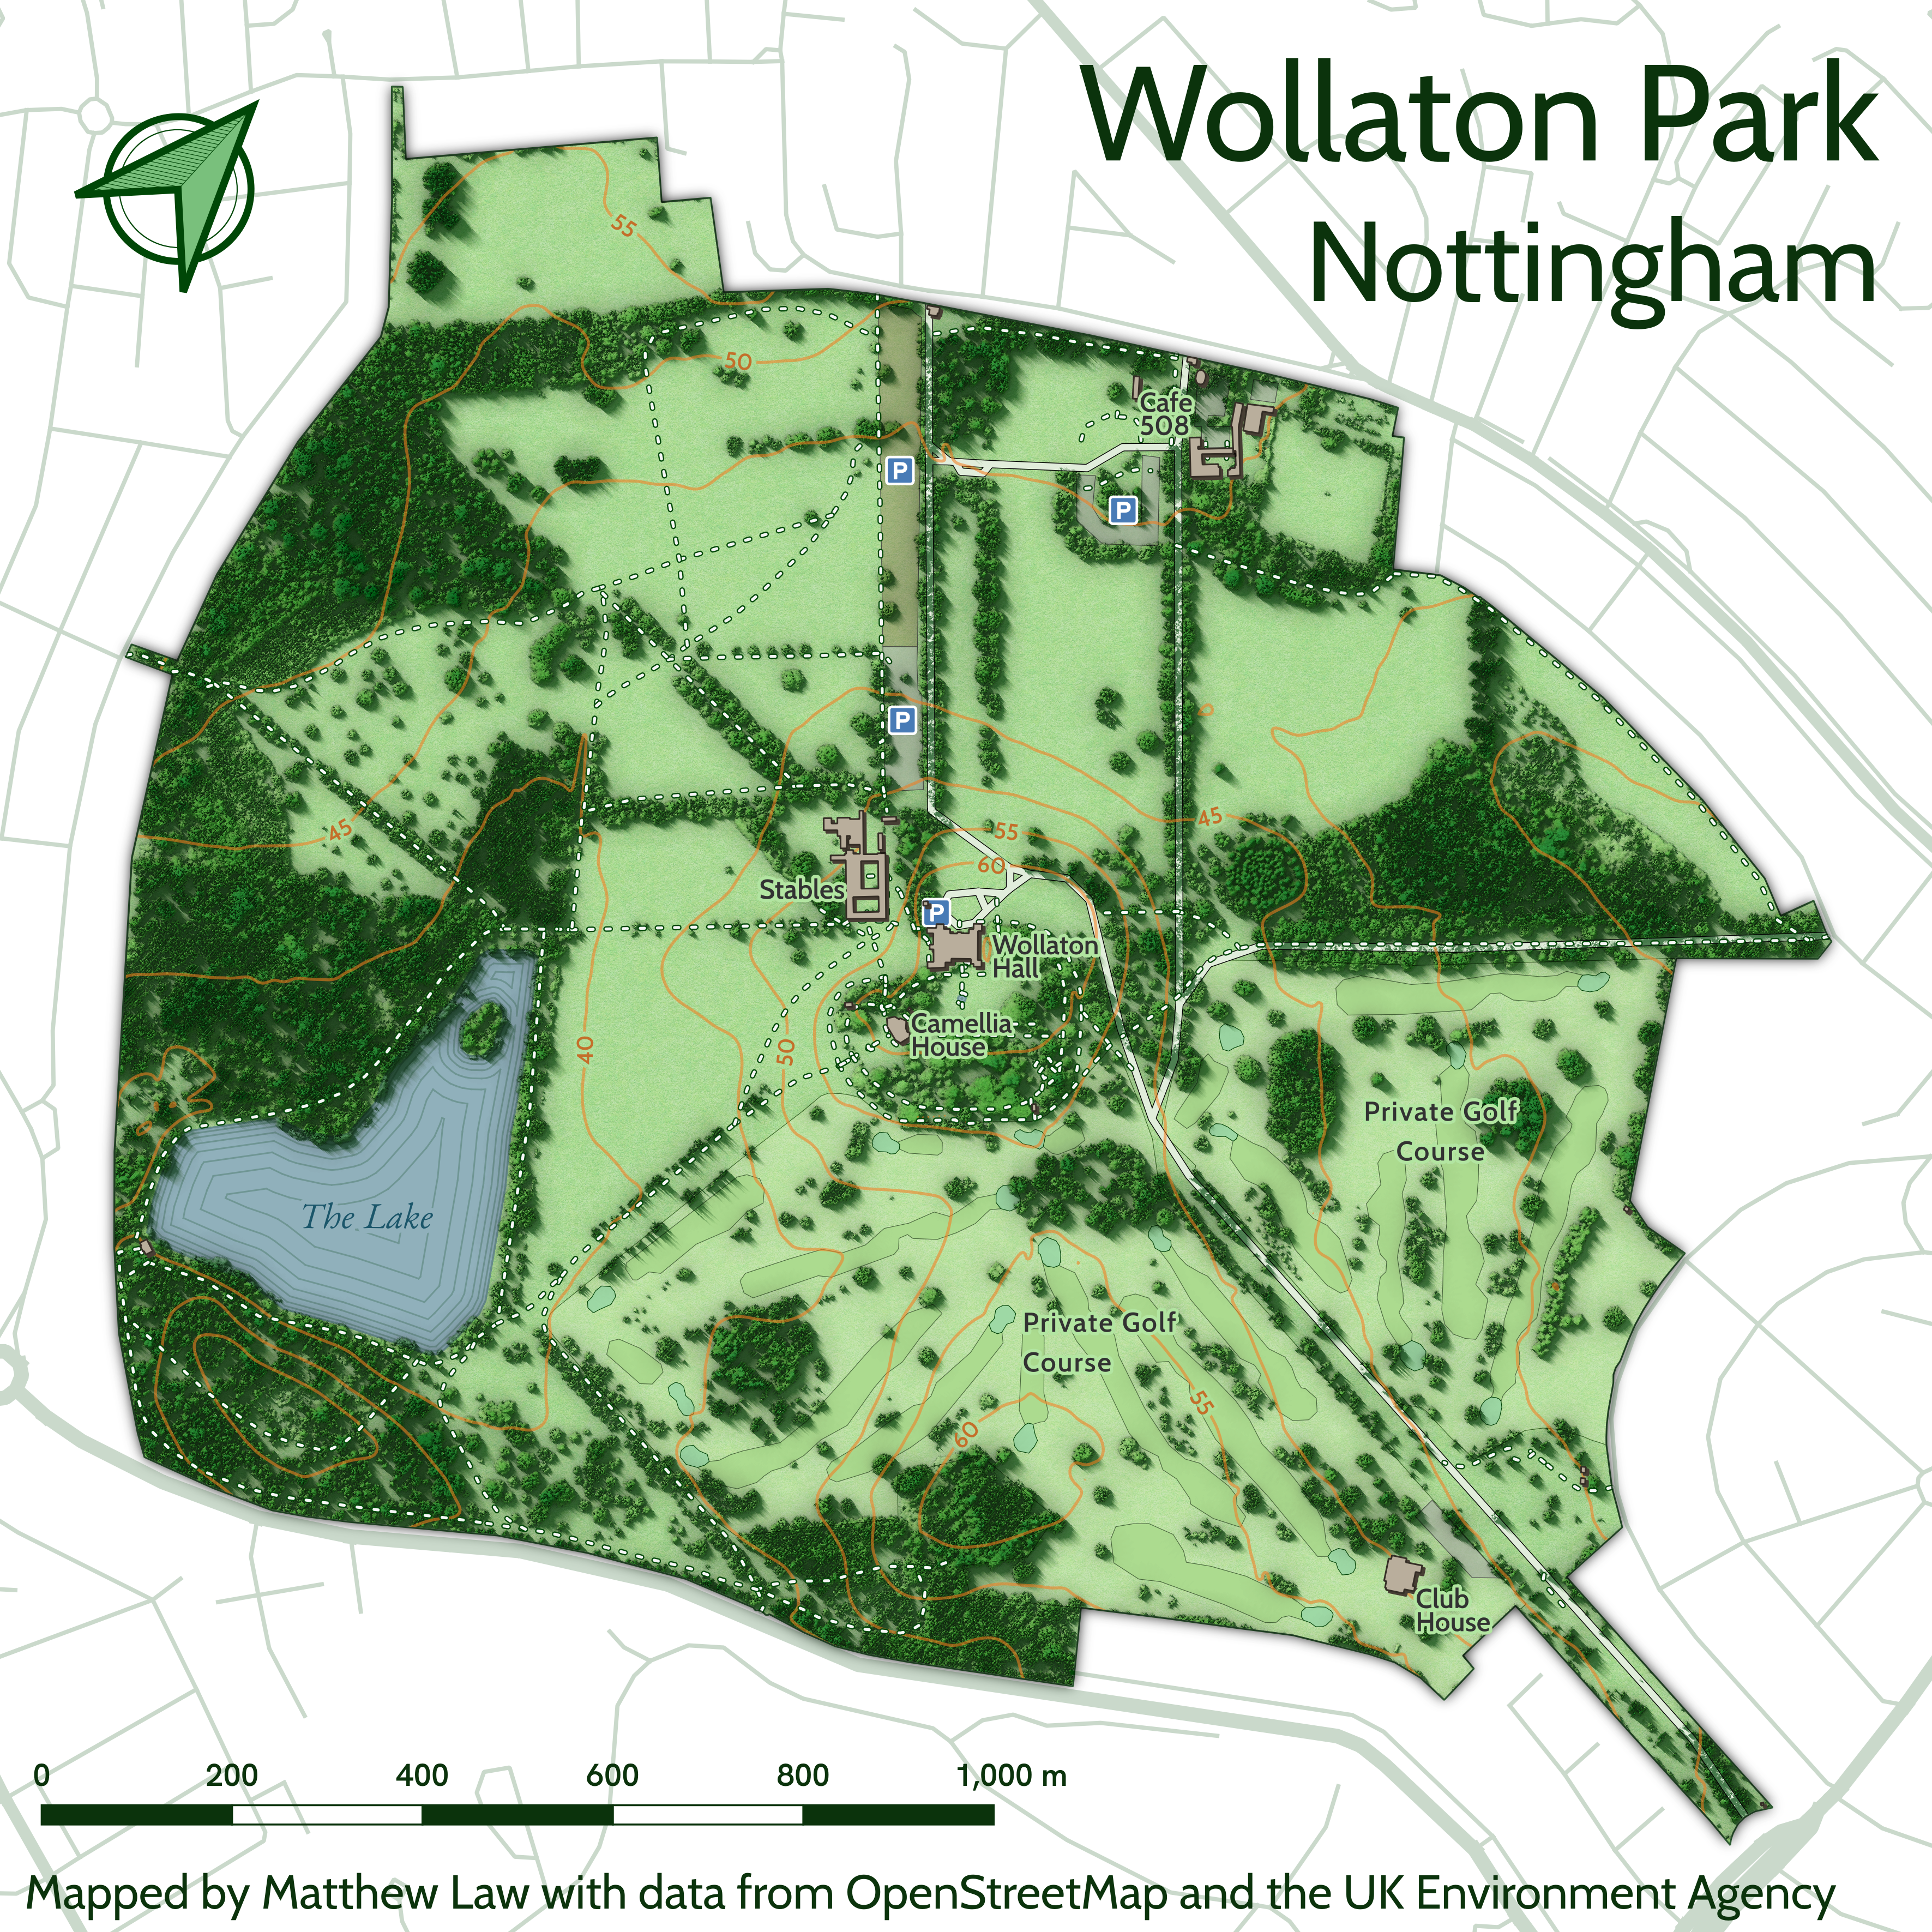
The primary inspiration for the map was the Environment Agency’s Vegetation Object Model data product, a raster where each pixel represents the top height of the canopy for all vegetation taller than 2.5 metres. I wanted to map somewhere with the right scale and mixture of vegetation coverage to nicely showcase the data, and Wollaton Park seemed to provide this.
The VOM does come with a prerendered hillshade layer, but I wanted to have a bit more control over this, so used the rayshader package in R to generate my own – R code to do so available here! This meant that I could choose my own angle for the shadows (meaning it wouldn’t look off when I rotated the map), and mix in a layer with subtle ambient lighting. The code includes a function to save the array that rayshader generates to a projected geotiff I could drag/drop into QGIS and have appear in the right place (harder than I thought it would have been, although I wouldn’t be surprised if I missed an easier way to achieve the same thing) so do steal that function if you ever need such a thing!
The contour lines were generated from a lidar composite DTM from Defra, and the rest of the data came from OpenStreetMap (I particularly like the individually mapped golf fairways and greens, although looking at it now I think the colours I chose are too subtle).
Everything was put together in QGIS, using geometry generator expressions to smooth the contours and generate waterlines for the lake, label masks for the labelling of both of these, and lots of use of the different layer blending modes to combine the various vegetation colour/shadow layers.