A Additional Figures
The following are additional figures not essential to the primary narrative of the dissertation, but which may be of interest as supplementary reference materials.
Table A.1 recreates Table 4.2, but does not exclude polygons containing fewer than ten house price data points.
| Segmentation | Mean QCoD | Mean | Distribution | Number of units |
|---|---|---|---|---|
| Morphological tessellation | 0.031 | 0.15 | 657 | |
| Enclosed tessellation | 0.030 | 0.06 | 1666 | |
| ET transposed to block | 0.061 | 0.23 | 412 | |
| ET transposed to H3 | 0.070 | 0.43 | 249 | |
| H3 basic | 0.058 | 0.22 | 370 | |
| H3 with ET characters | 0.066 | 0.57 | 188 | |
| Spatially constrained MT | 0.080 | 5.61 | 18 | |
| Existing neighbourhoods | 0.071 | 1.36 | 75 | |
| Existing districts | 0.115 | 8.48 | 12 | |
| idealista polygons | 0.075 | 1.33 | 74 |
Figure A.1 recreates Figure 4.12, but again does not exclude polygons containing fewer than ten house price data points. By comparing the two figures, it is clear which segmentations included the most polygons with few corresponding house price data points. For instance, the morphological tessellation segmentation moves from far below the straight line to above it when these values are excluded.
Figure A.1: Segmentation averages of polgyons plot by house price QCoD and area.
Figure A.2 shows a segmentation produced using enclosed tessellation cells and clustering primary characters (i.e each tessellation cell has no information about its neighbours), while Figure A.3 shows a segmentation produced using ET cells and clustering contextual characters incorporating information from cells up to 3rd order topological distance away.
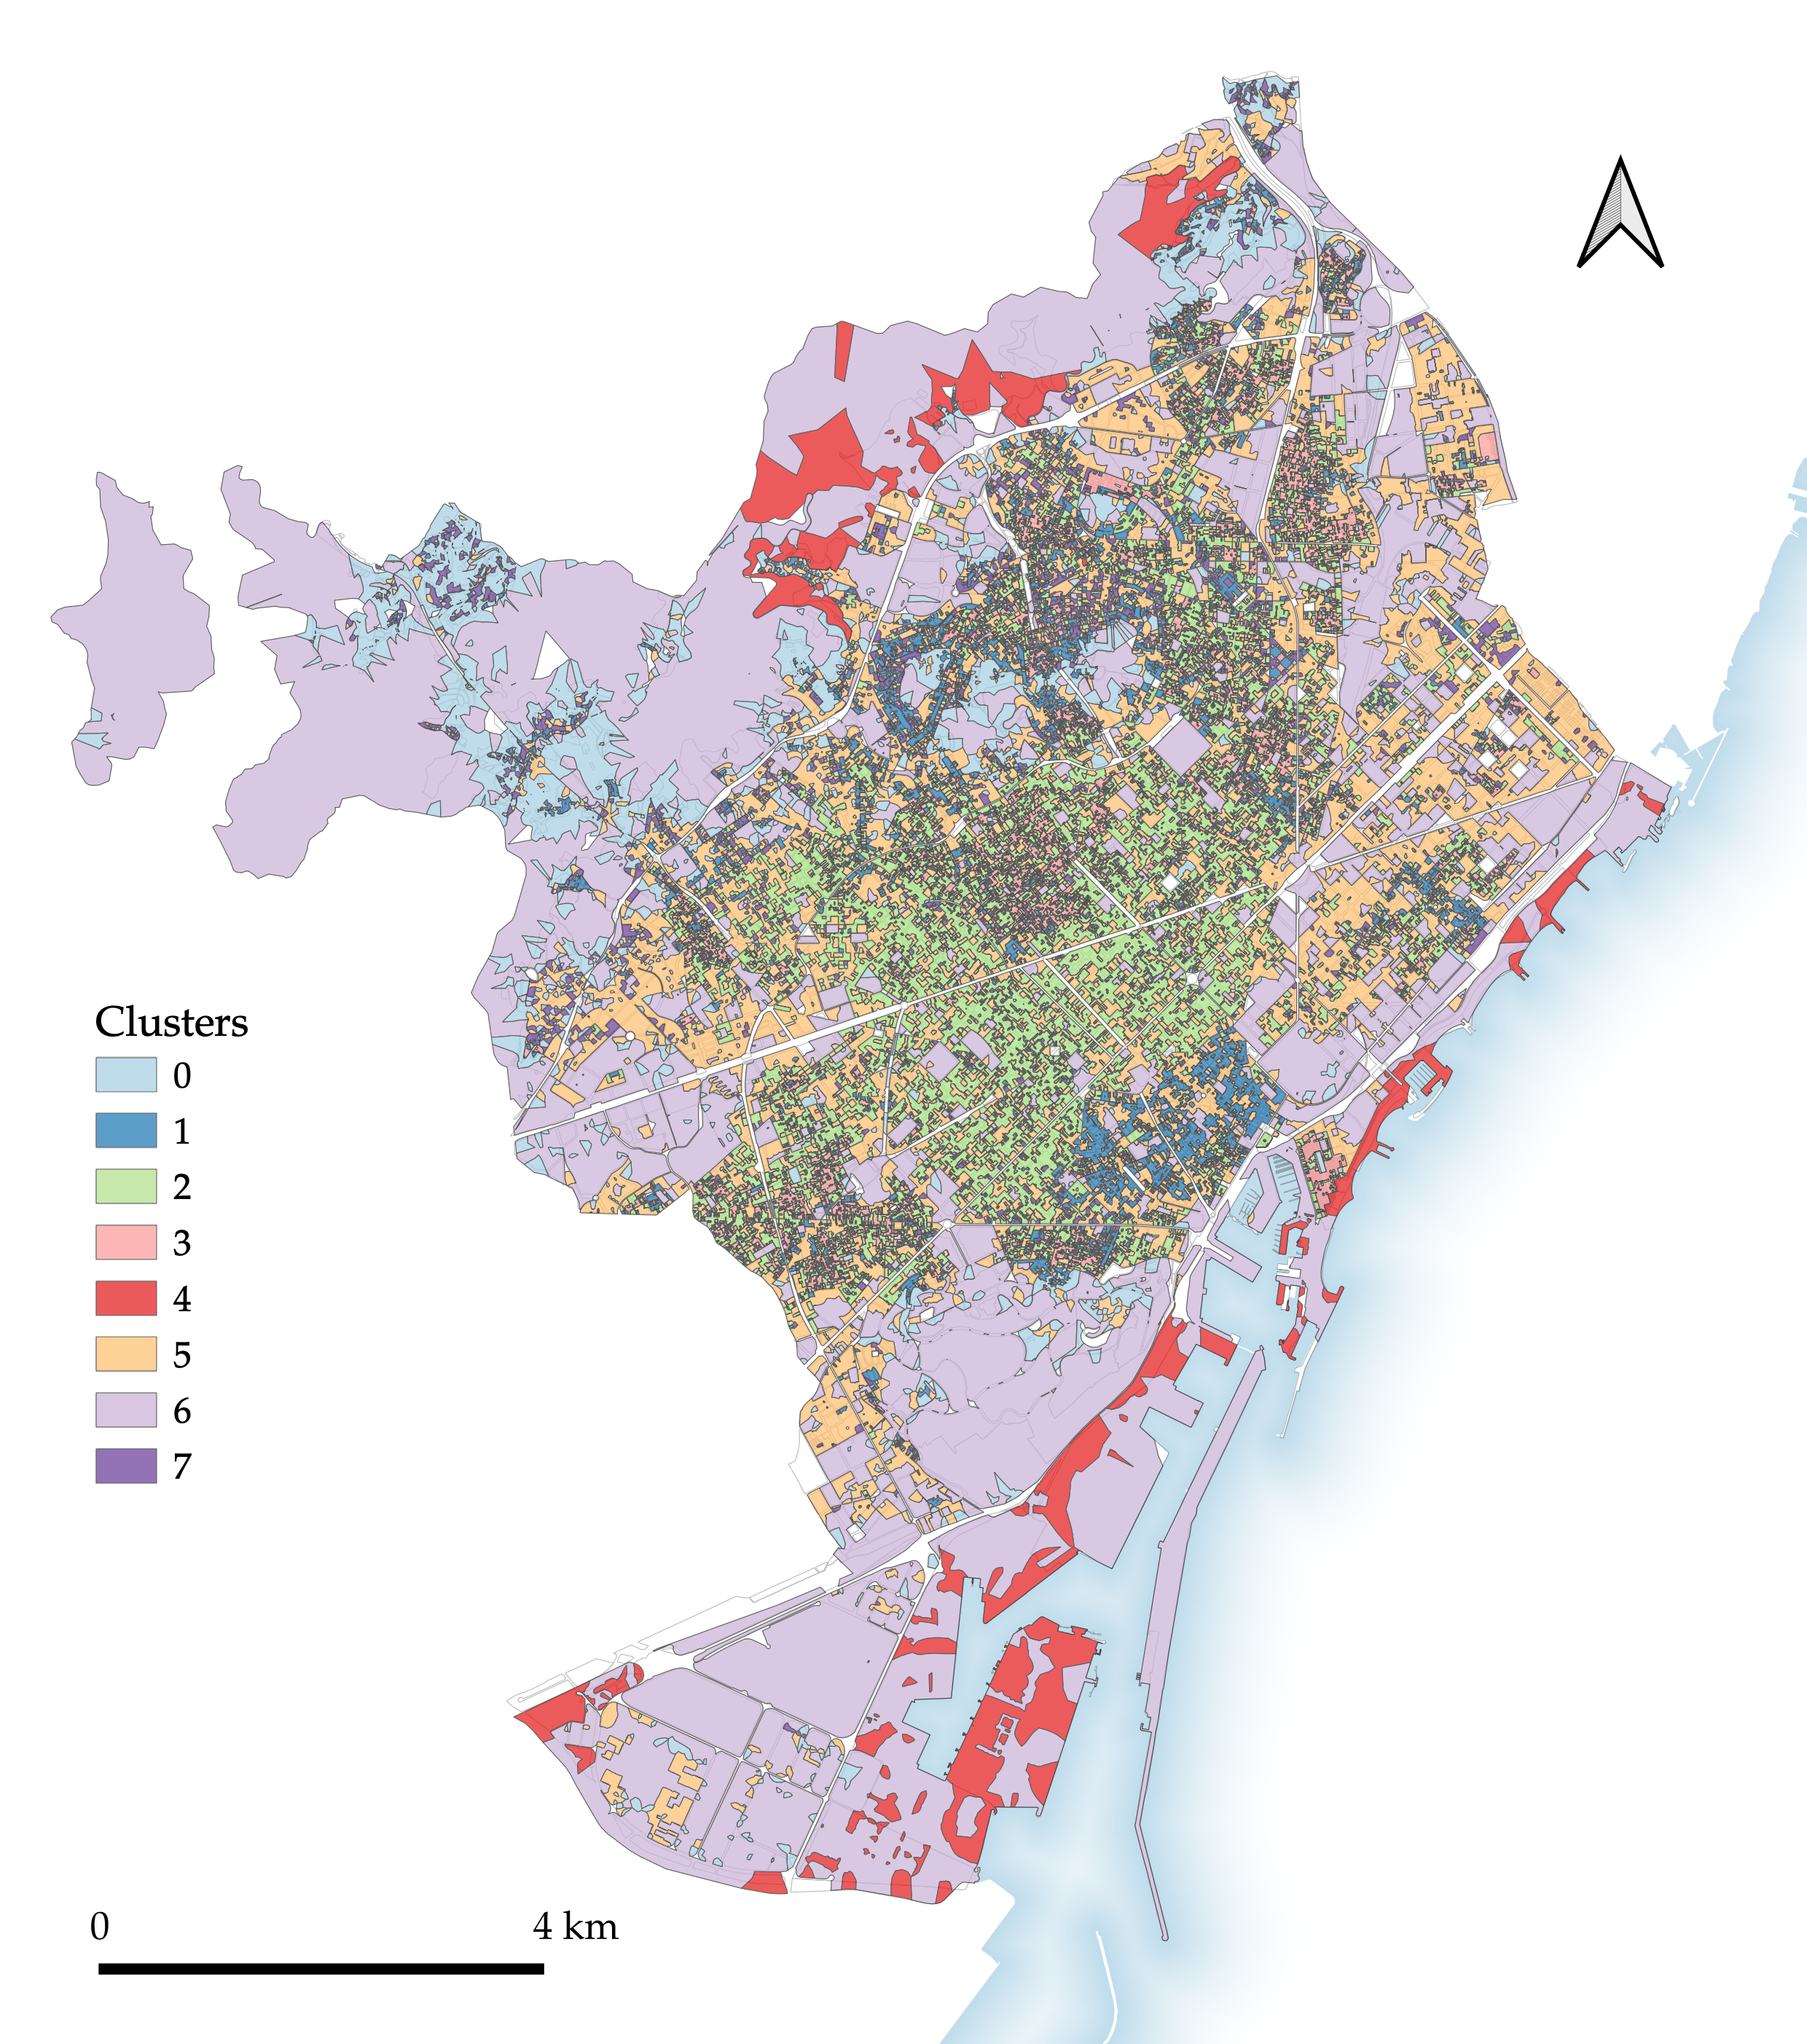
Figure A.2: Enclosed tessellation with primary characters.
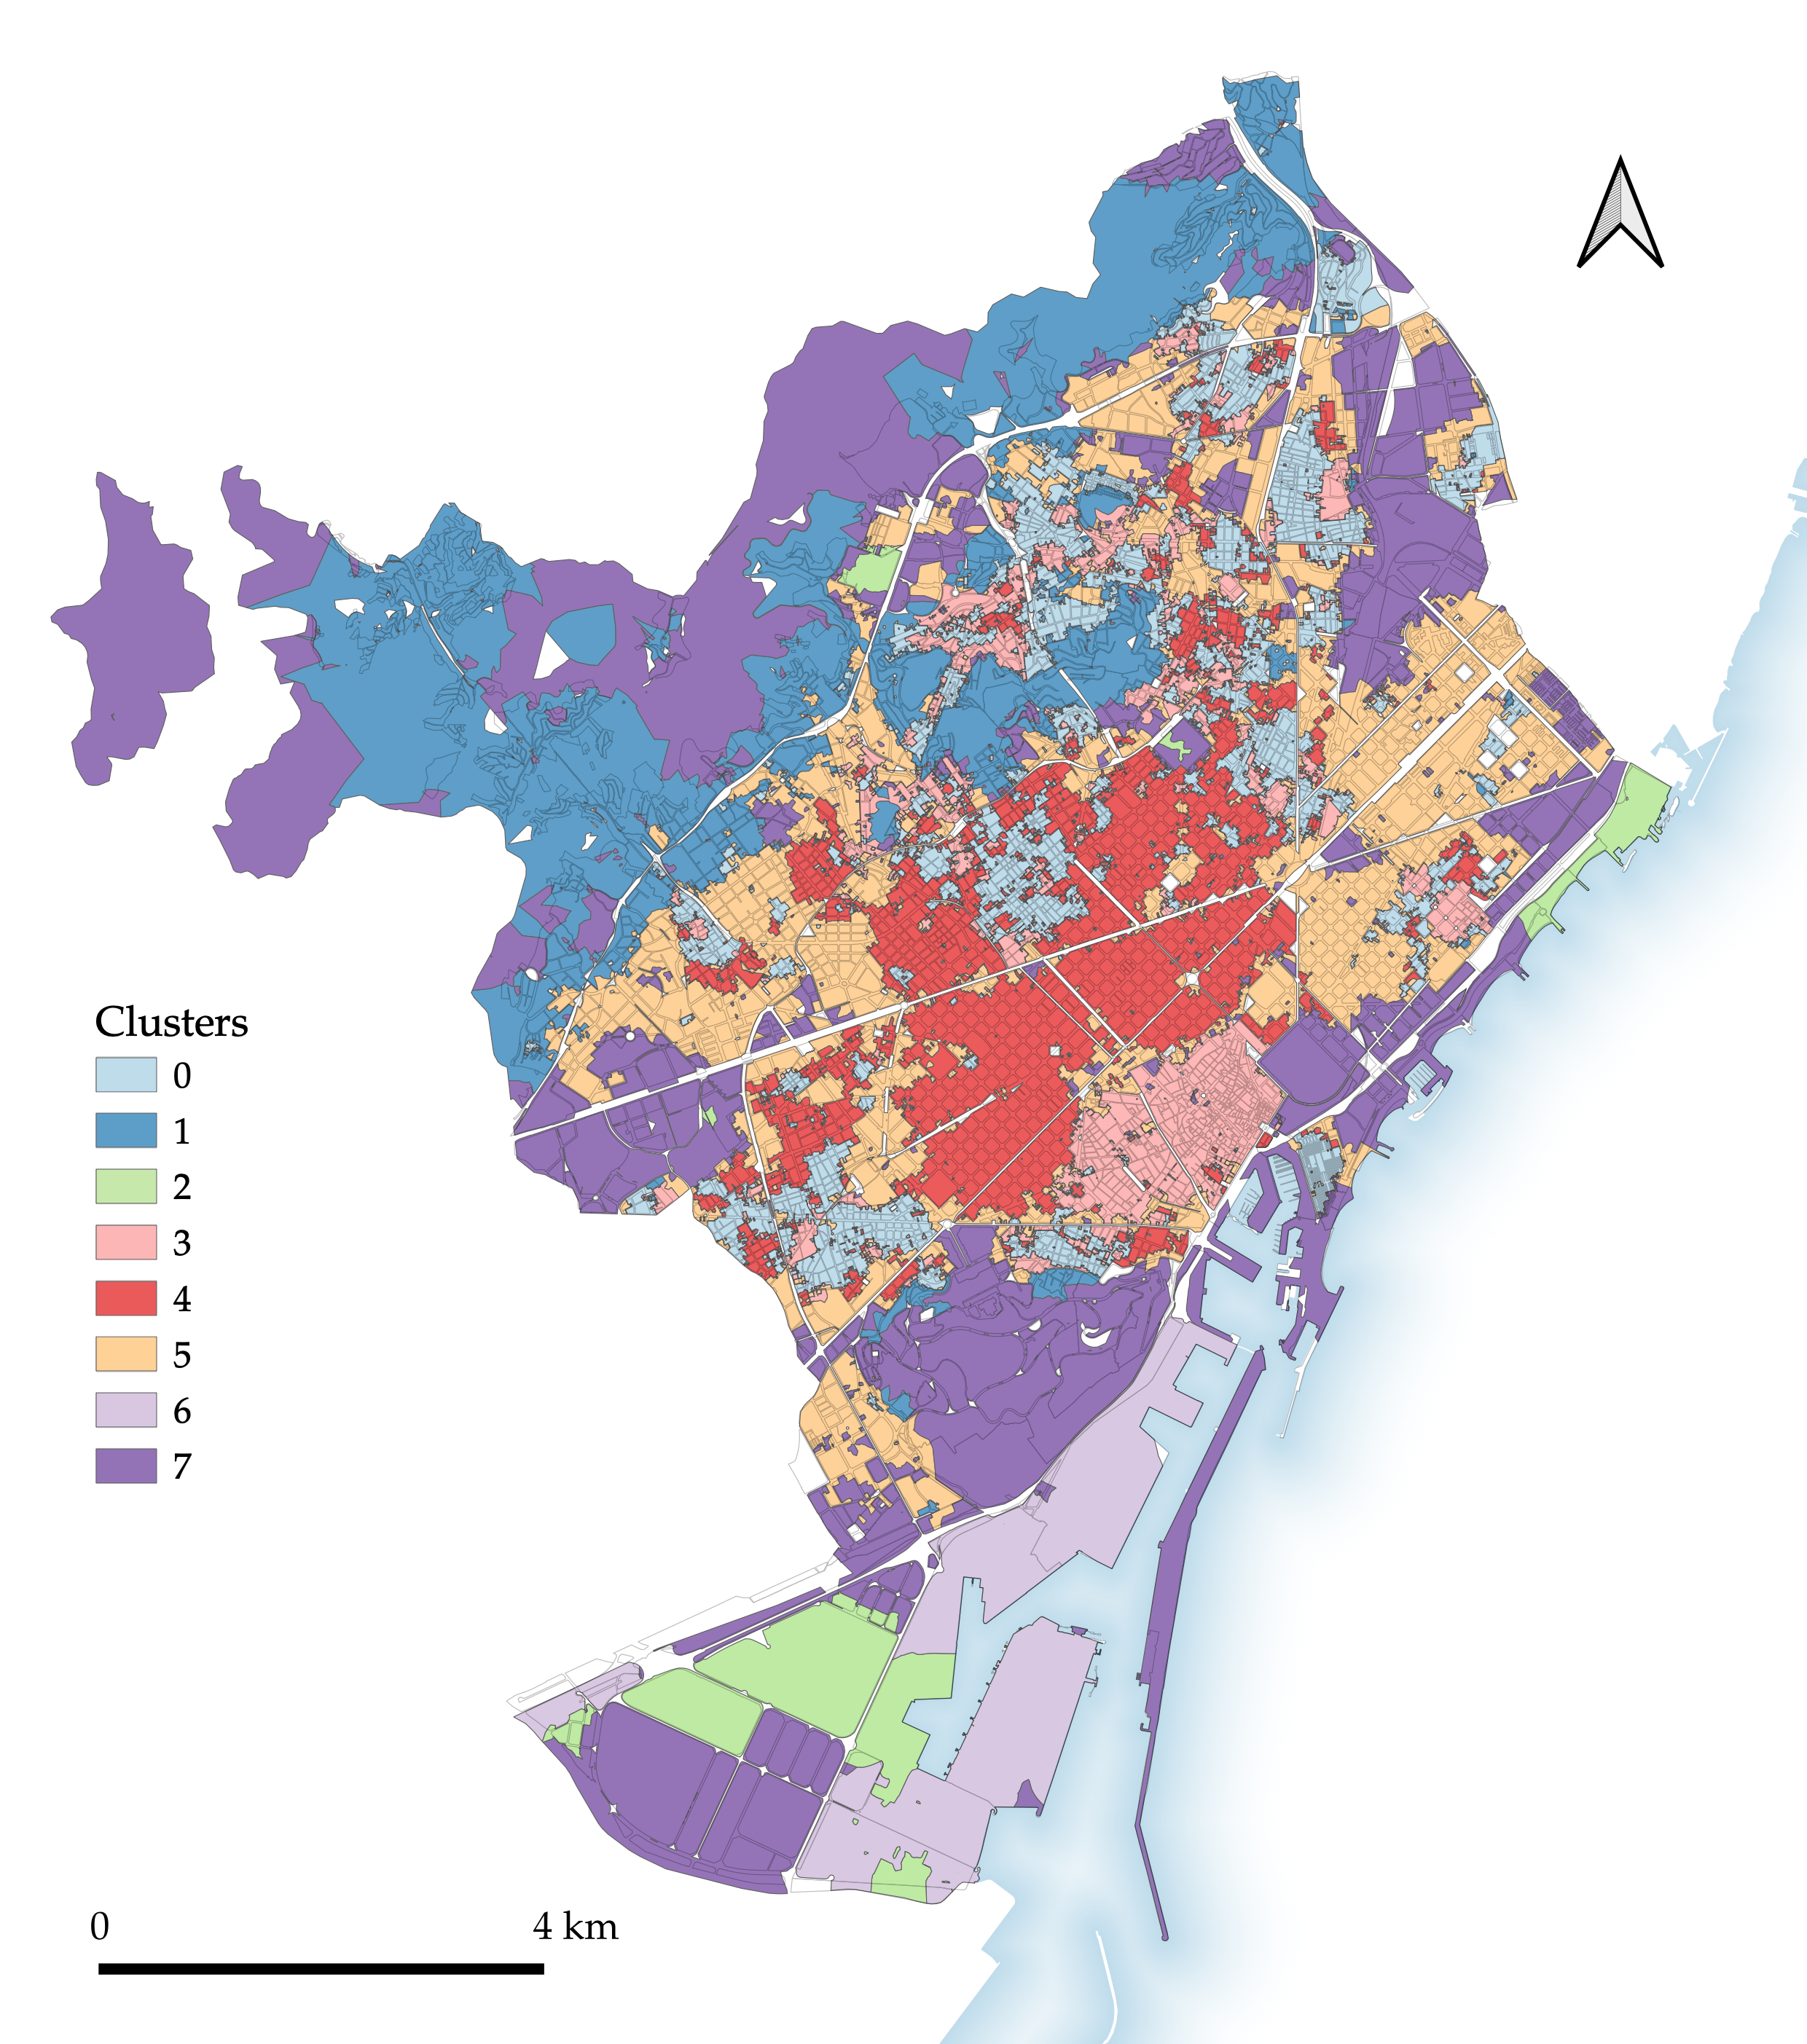
Figure A.3: Enclosed tessellation with contextual characters generated using 3rd order spatial weights.